使用 Leaflet 地圖
前言
最近剛好要更新地圖應用。先前是直接使用 Mapbox ,但覺得它的 Marker 操作起來不是很彈性。因緣際會下聽說了 Leaflet ,就來試看看吧。
維基百科是這樣說的。
Leaflet是一個開源的JavaScript庫,用於構建Web地圖應用。首次發布於2011年,2它支持大多數移動和桌面平台,支持HTML5和CSS3。
主要內容
安裝方式
本文撰寫時會以 CDN 的方式引入 Leaflet.js,實際使用時筆者是會使用套件管理工具進行安裝。 安裝方式:
1yarn add leaflet
使用 CDN 的方式:
1 <link rel="stylesheet" href="https://unpkg.com/leaflet@1.7.1/dist/leaflet.css"
2   integrity="sha512-xodZBNTC5n17Xt2atTPuE1HxjVMSvLVW9ocqUKLsCC5CXdbqCmblAshOMAS6/keqq/sMZMZ19scR4PsZChSR7A=="
3   crossorigin=""/>
4
5<!-- Make sure you put this AFTER Leaflet's CSS -->
6 <script src="https://unpkg.com/leaflet@1.7.1/dist/leaflet.js"
7   integrity="sha512-XQoYMqMTK8LvdxXYG3nZ448hOEQiglfqkJs1NOQV44cWnUrBc8PkAOcXy20w0vlaXaVUearIOBhiXZ5V3ynxwA=="
8   crossorigin=""></script>
起手式
在網頁中加入
1<div id="map" style="width:95vw;height:95vh" />
初始化地圖
1var map = L.map('map').setView([34.985851028839406, 135.75788488621308], 10);
2L.tileLayer('https://{s}.tile.openstreetmap.org/{z}/{x}/{y}.png?{foo}',
3 {
4 foo: 'bar',
5 attribution: '© <a href="https://www.openstreetmap.org/copyright">OpenStreetMap</a> contributors',
6 }).addTo(map);
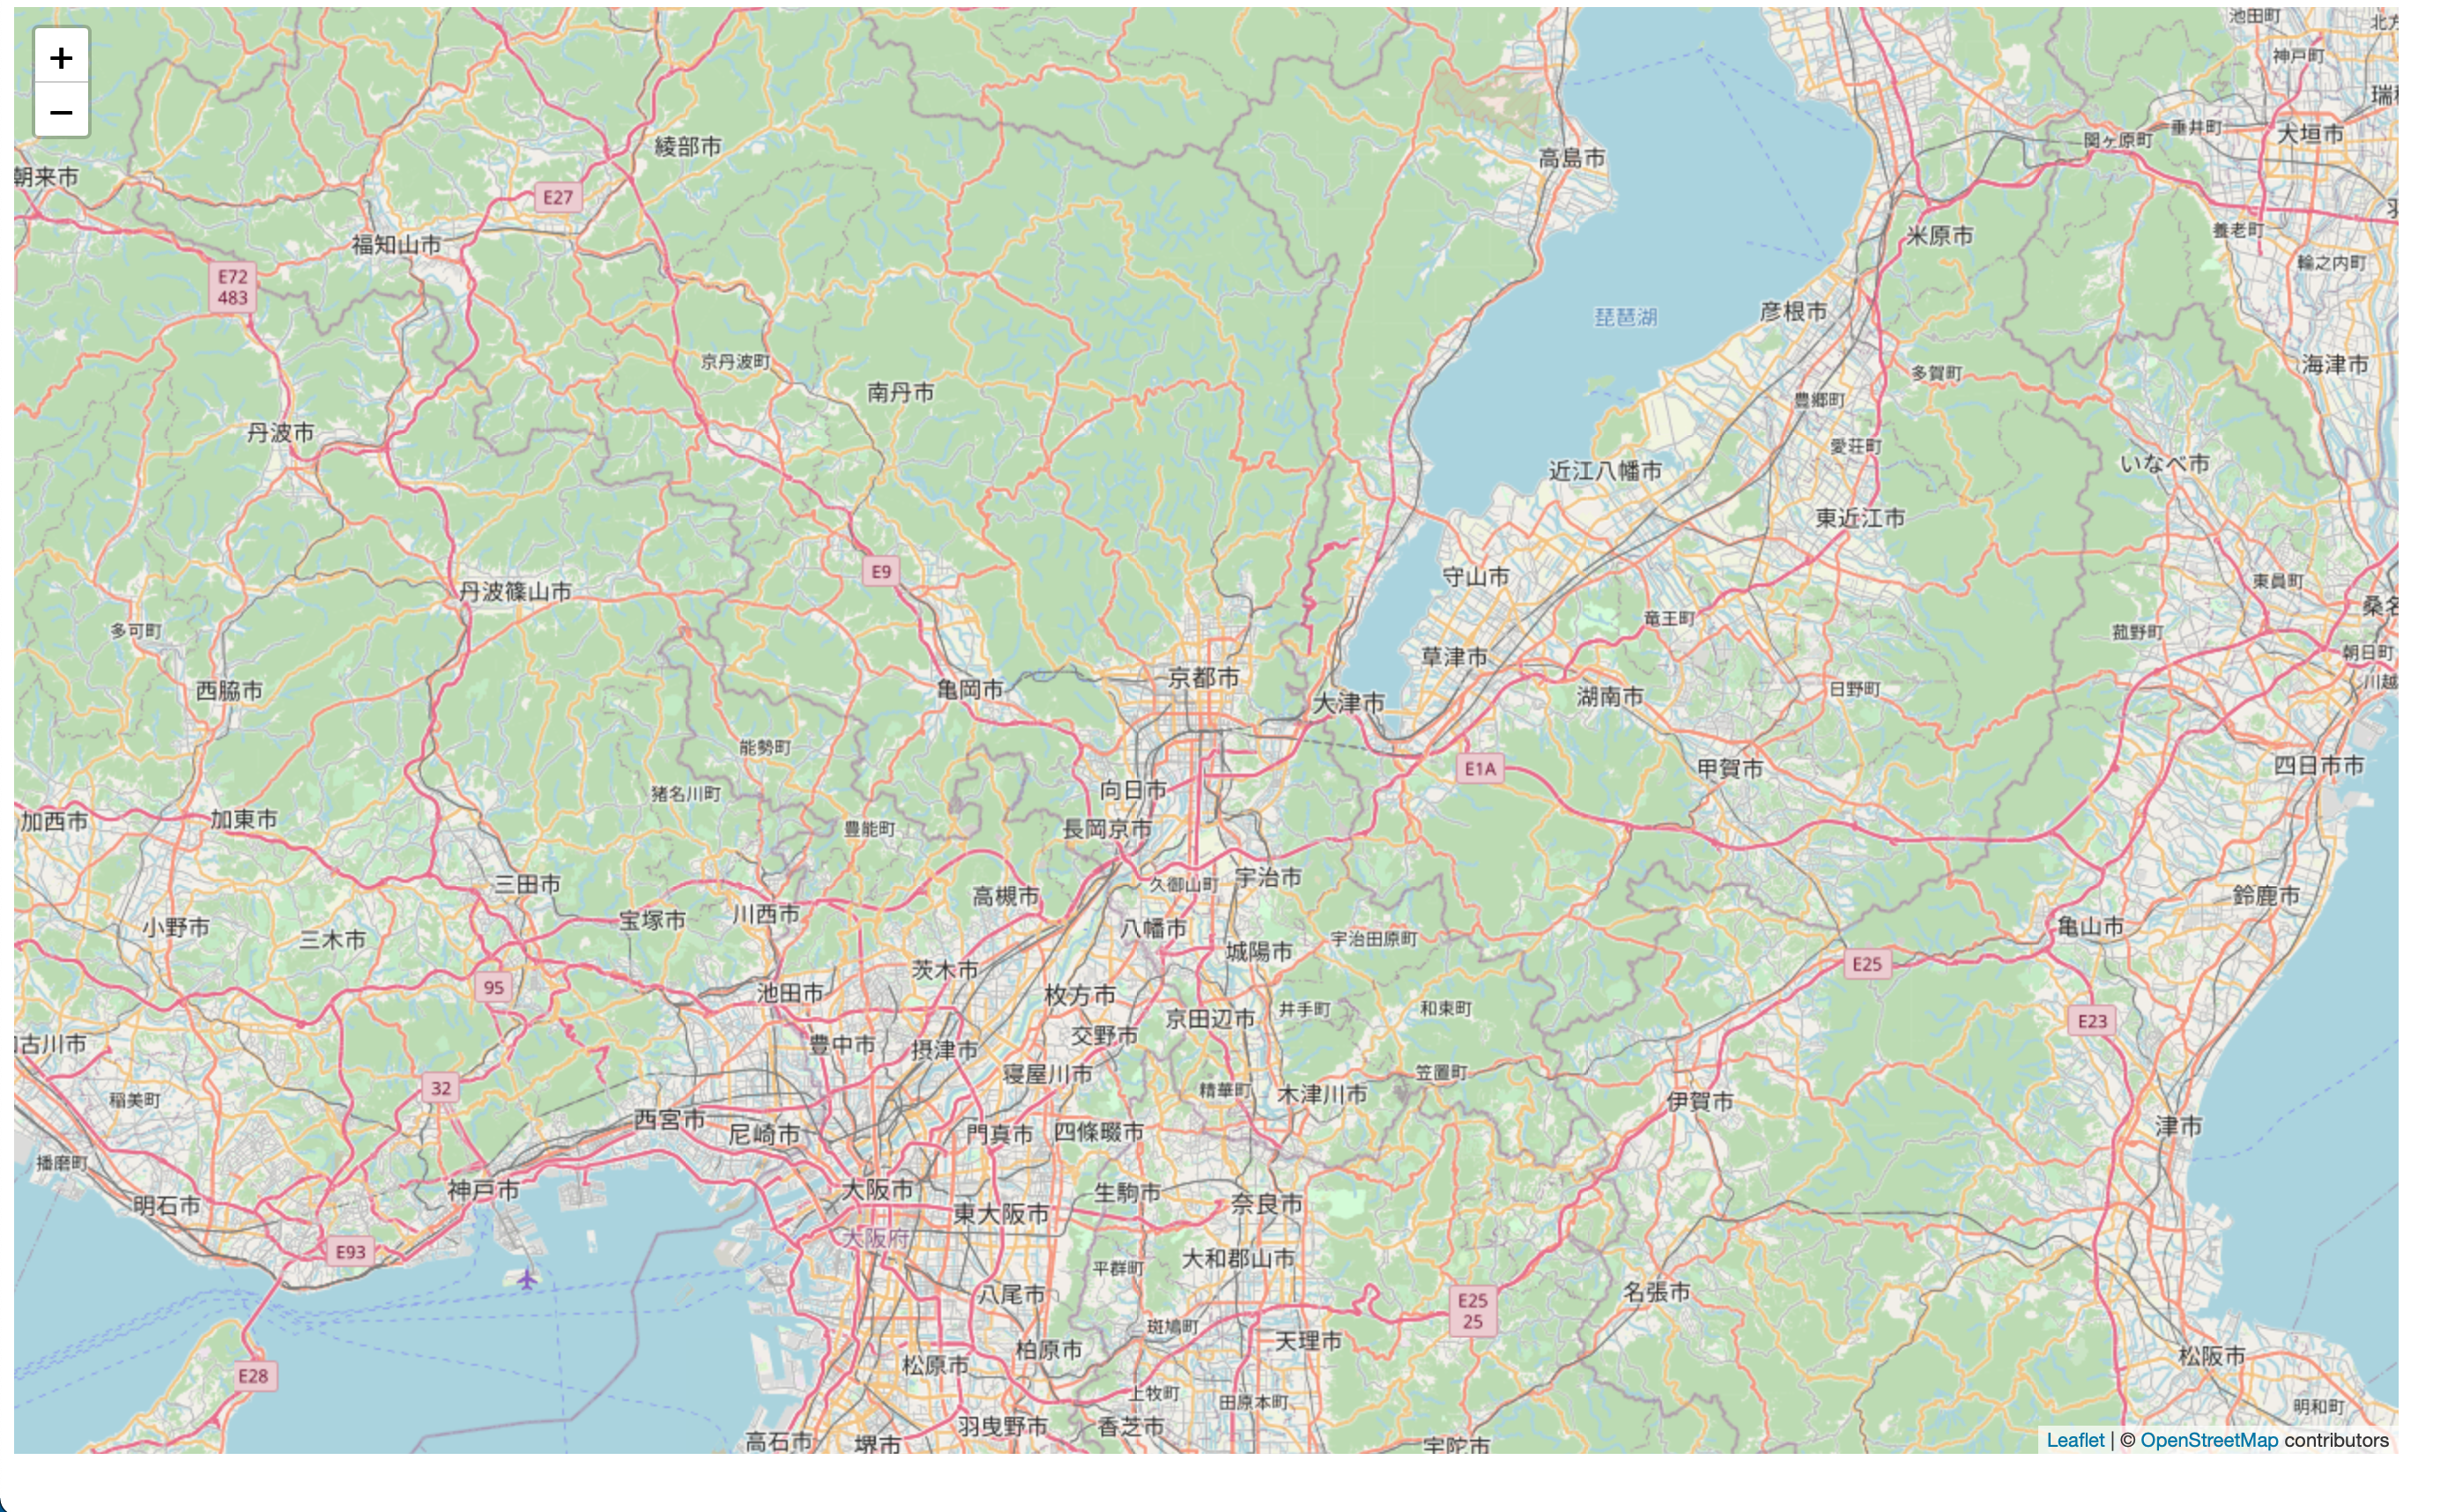
我們的第一張地圖
如果我們想要使用 Mapbox 的圖資,在已取得存取金鑰之後(Access Toekn),可在建立 titleLayer 時改用下列方式初始化。
1var map = L.map('map').setView([34.985851028839406, 135.75788488621308], 10);
2L.tileLayer(''https://api.mapbox.com/styles/v1/{id}/tiles/{z}/{x}/{y}?access_token={accessToken}',
3 {
4 attribution: '© <a href="https://www.mapbox.com/about/maps/">Mapbox</a> contributors'
5 maxZoom: 18,
6 zoomOffset: -1,
7 tileSize: 512,
8 id: 'mapbox/streets-v11',
9 accessToken: token
10 }).addTo(map);
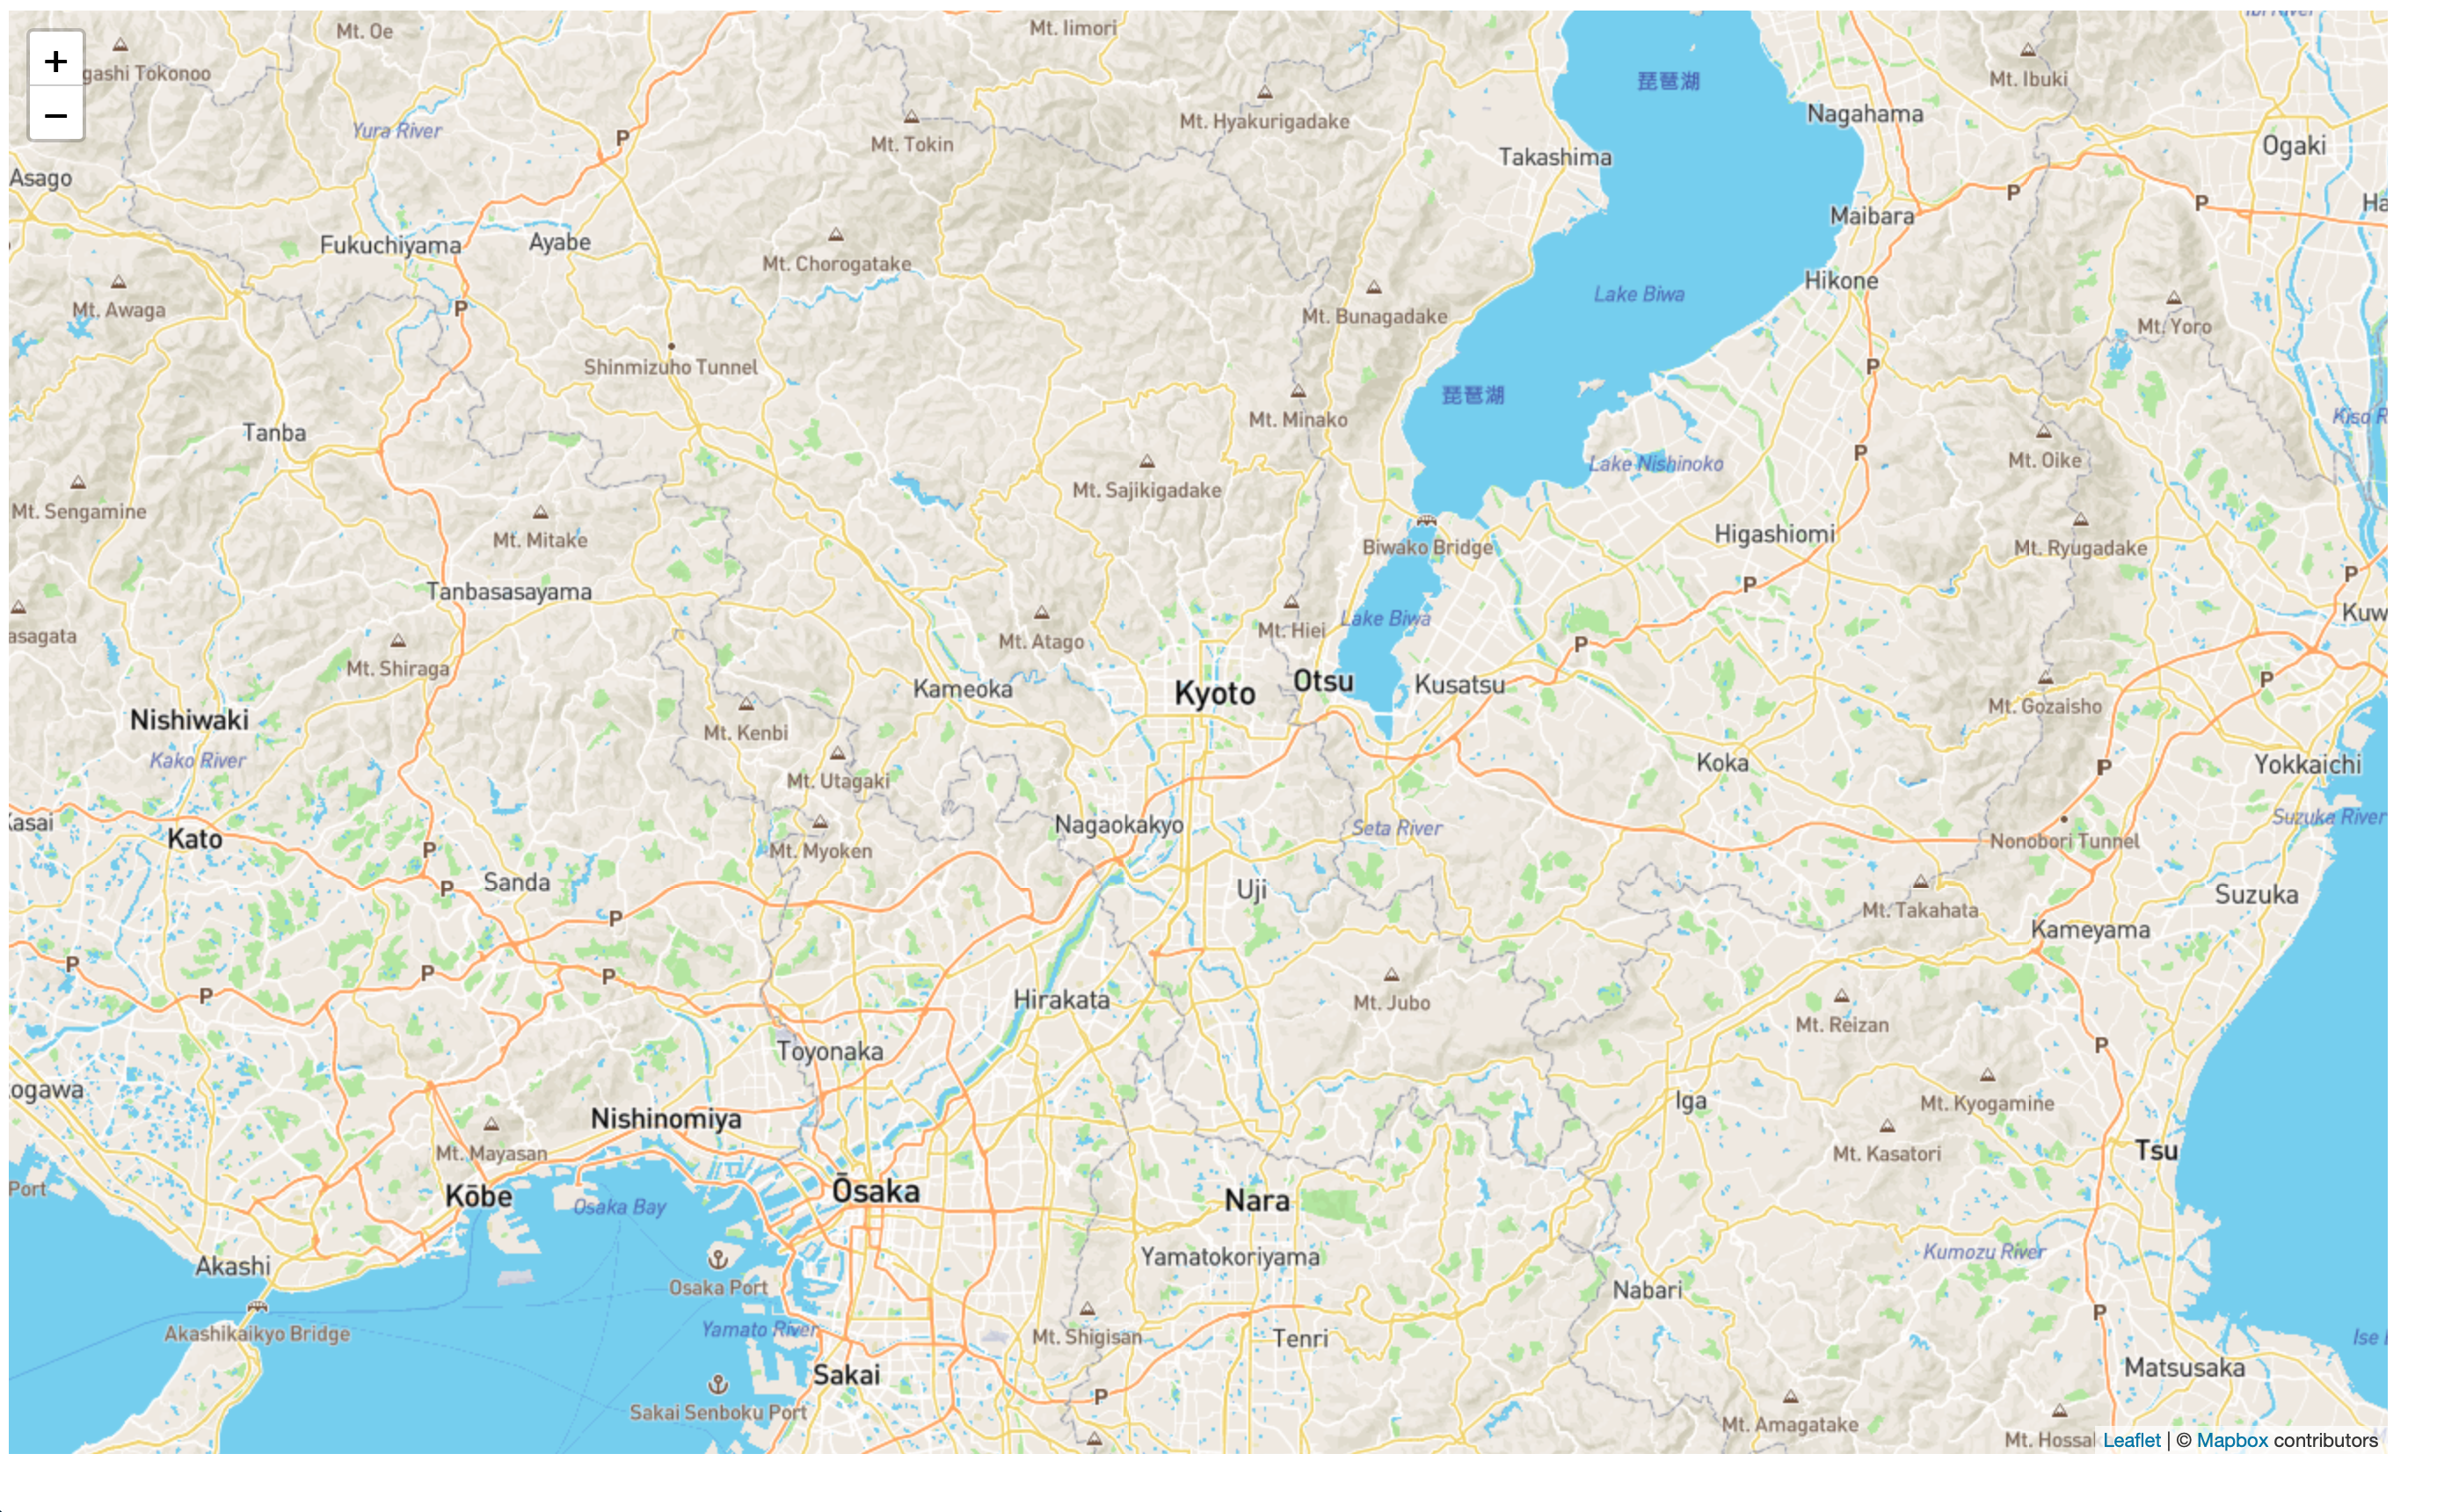
使用 Mapbox 圖資
如果想要移除預設的 zoom controller 可以在初始化的時候加上 zoomControl: false
1var map = L.map('map', {zoomControl: false}).setView([34.985851028839406, 135.75788488621308], 10);
加上 Marker
在 Leaflet 中加上 marker 就跟呼吸一樣自然。
1L.marker([35.04074994371372, 135.72932367775914]).addTo(map);
2L.marker([34.97374817523019, 135.77195253085293]).addTo(map);
3L.marker([34.99936852552379, 135.7854861479551]).addTo(map);
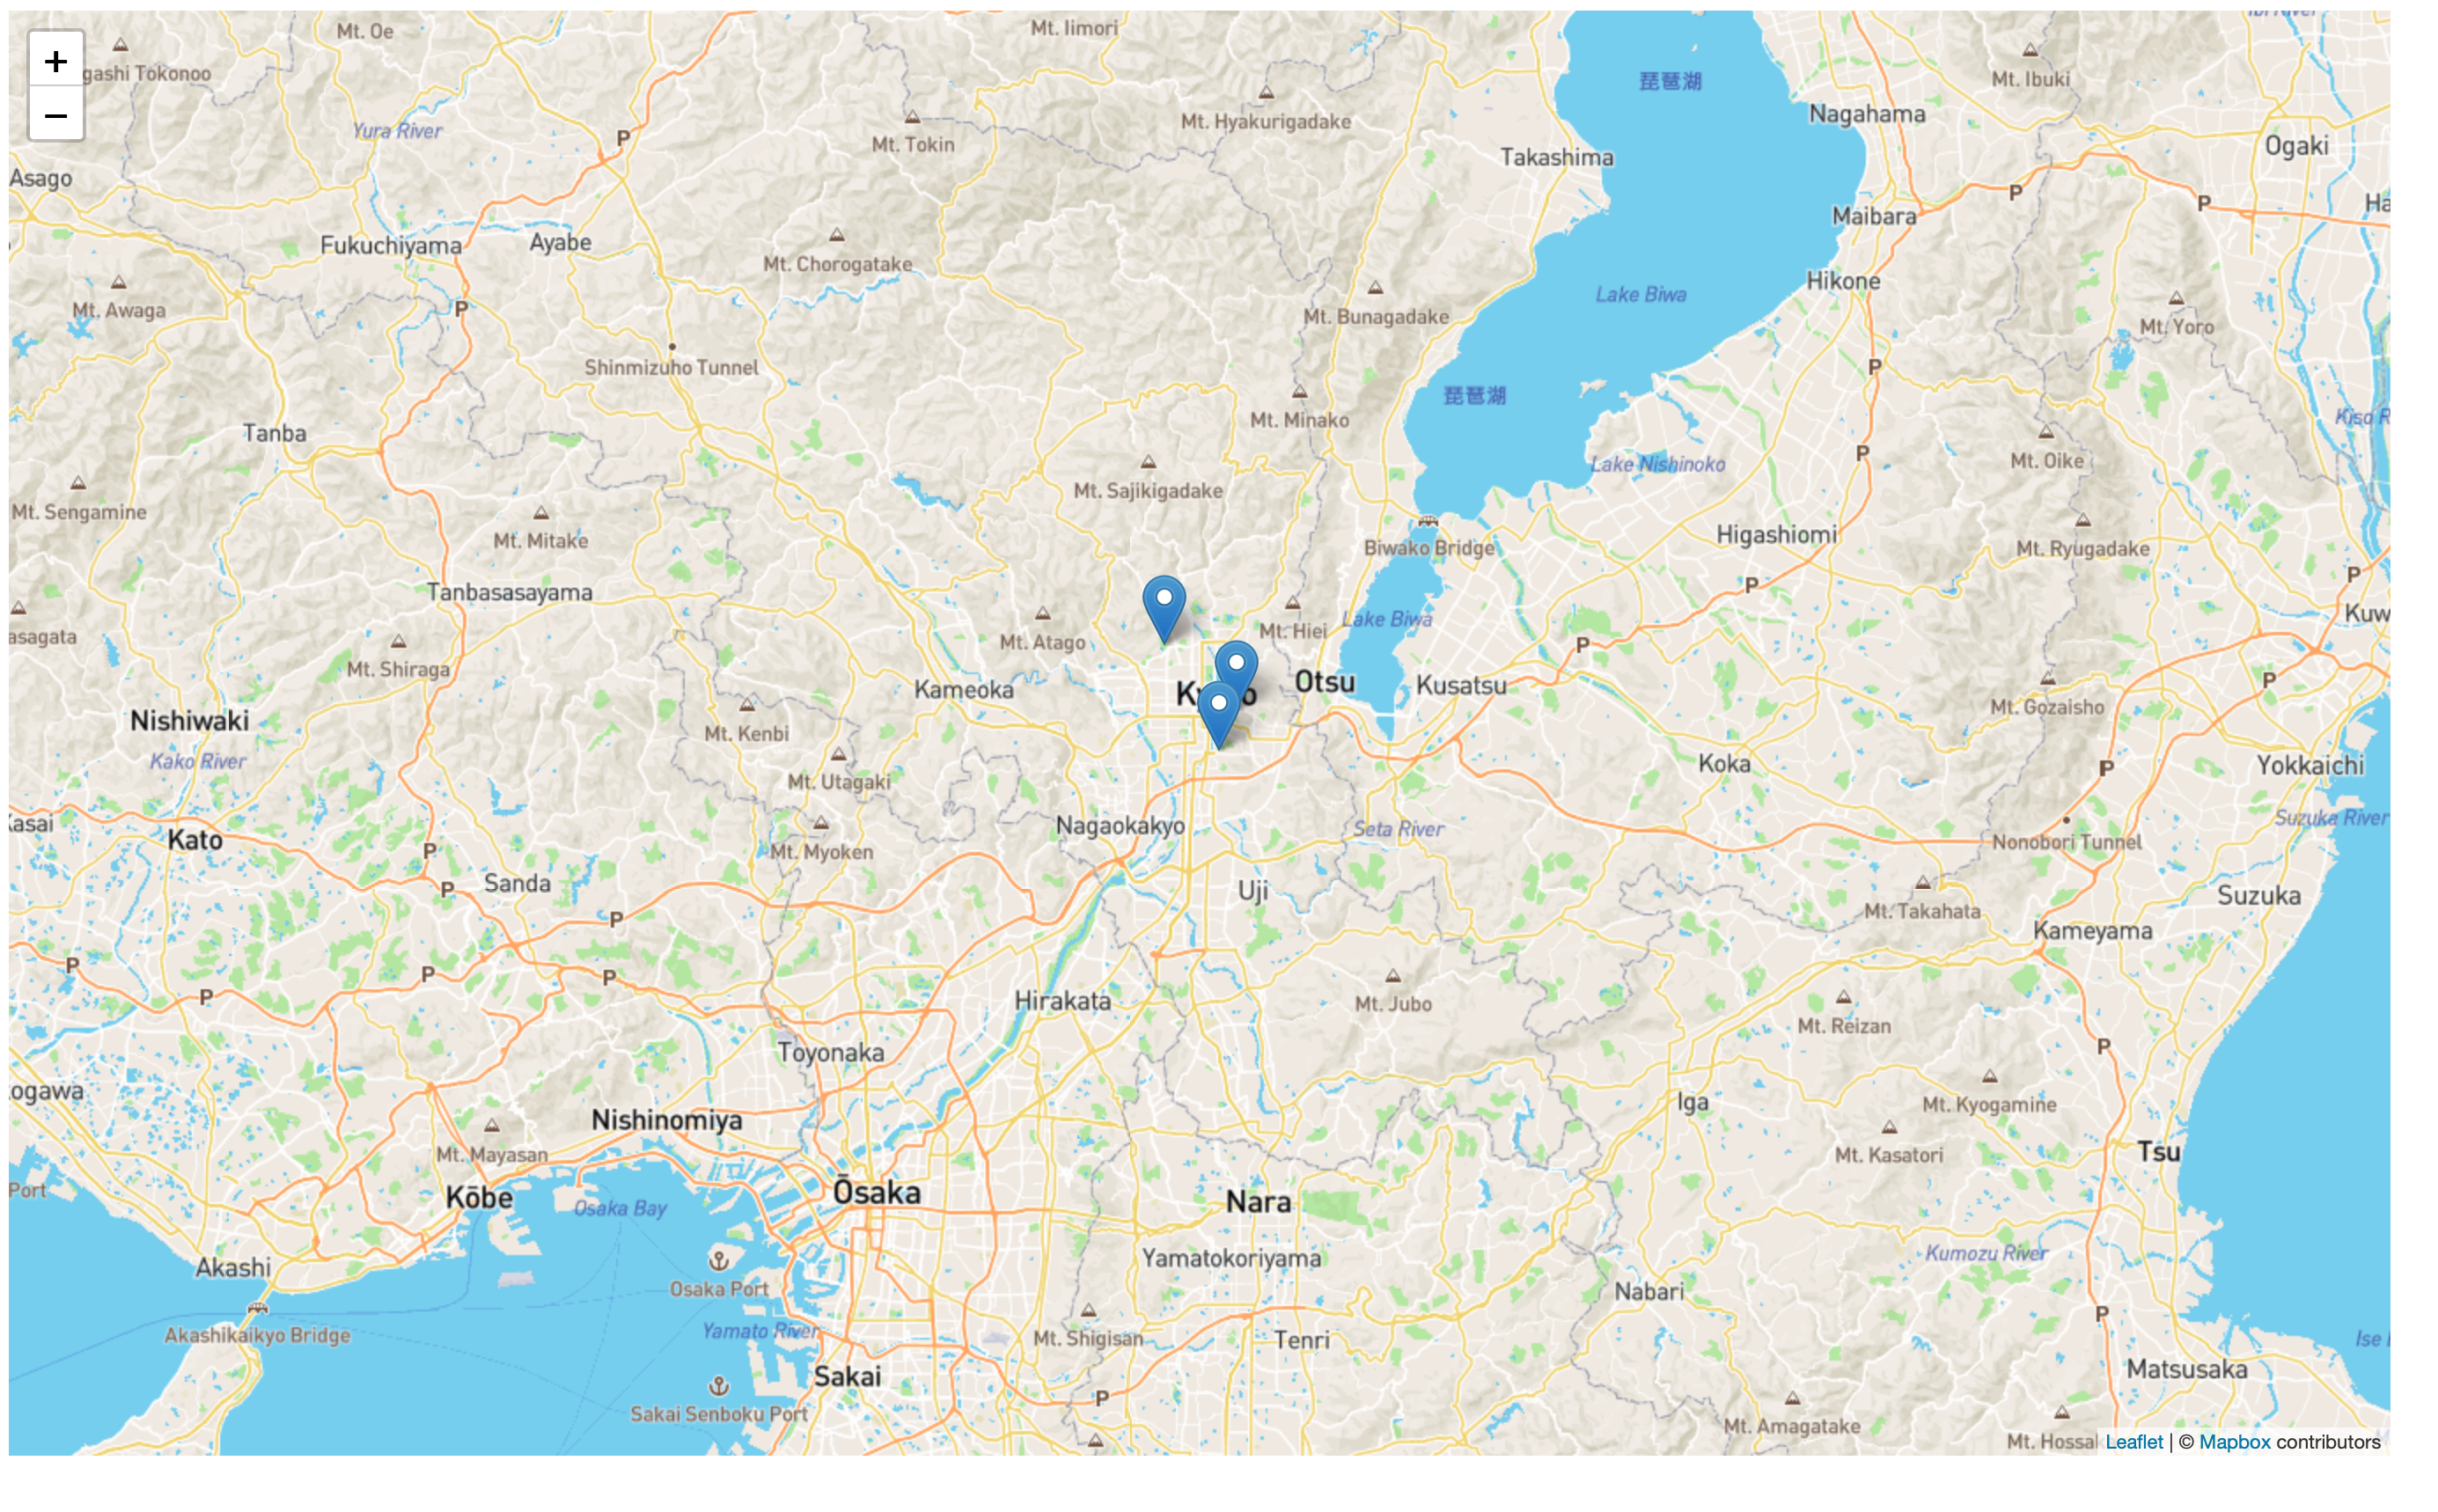
加上 marker
如果想要改變樣式,可以透過 icon 或是 iconDiv 來更改。
 1var myIcon = L.icon({
 2    iconUrl: 'marker.png',
 3    iconSize: [100, 95],
 4    iconAnchor: [22, 94],
 5    popupAnchor: [-3, -76],
 6    shadowUrl: 'my-icon-shadow.png',
 7    shadowSize: [68, 95],
 8    shadowAnchor: [22, 94]
 9});
10L.marker([34.70432671595862, 135.50096236284378], {
11	icon: myIcon
12}).addTo(map);
1var myDivIcon = L.divIcon({
2    className:'my-div-icon-wrapper',
3    html:`<div>這是 Div Icon </div>`
4});
5L.marker([34.68985107822455, 135.5253549268327], {
6	icon: myDivIcon
7}).addTo(map);
1.my-div-icon-wrapper div{
2    width: 100px;
3    background-color: #060390;
4    color: #eee;
5    text-align: center;
6}
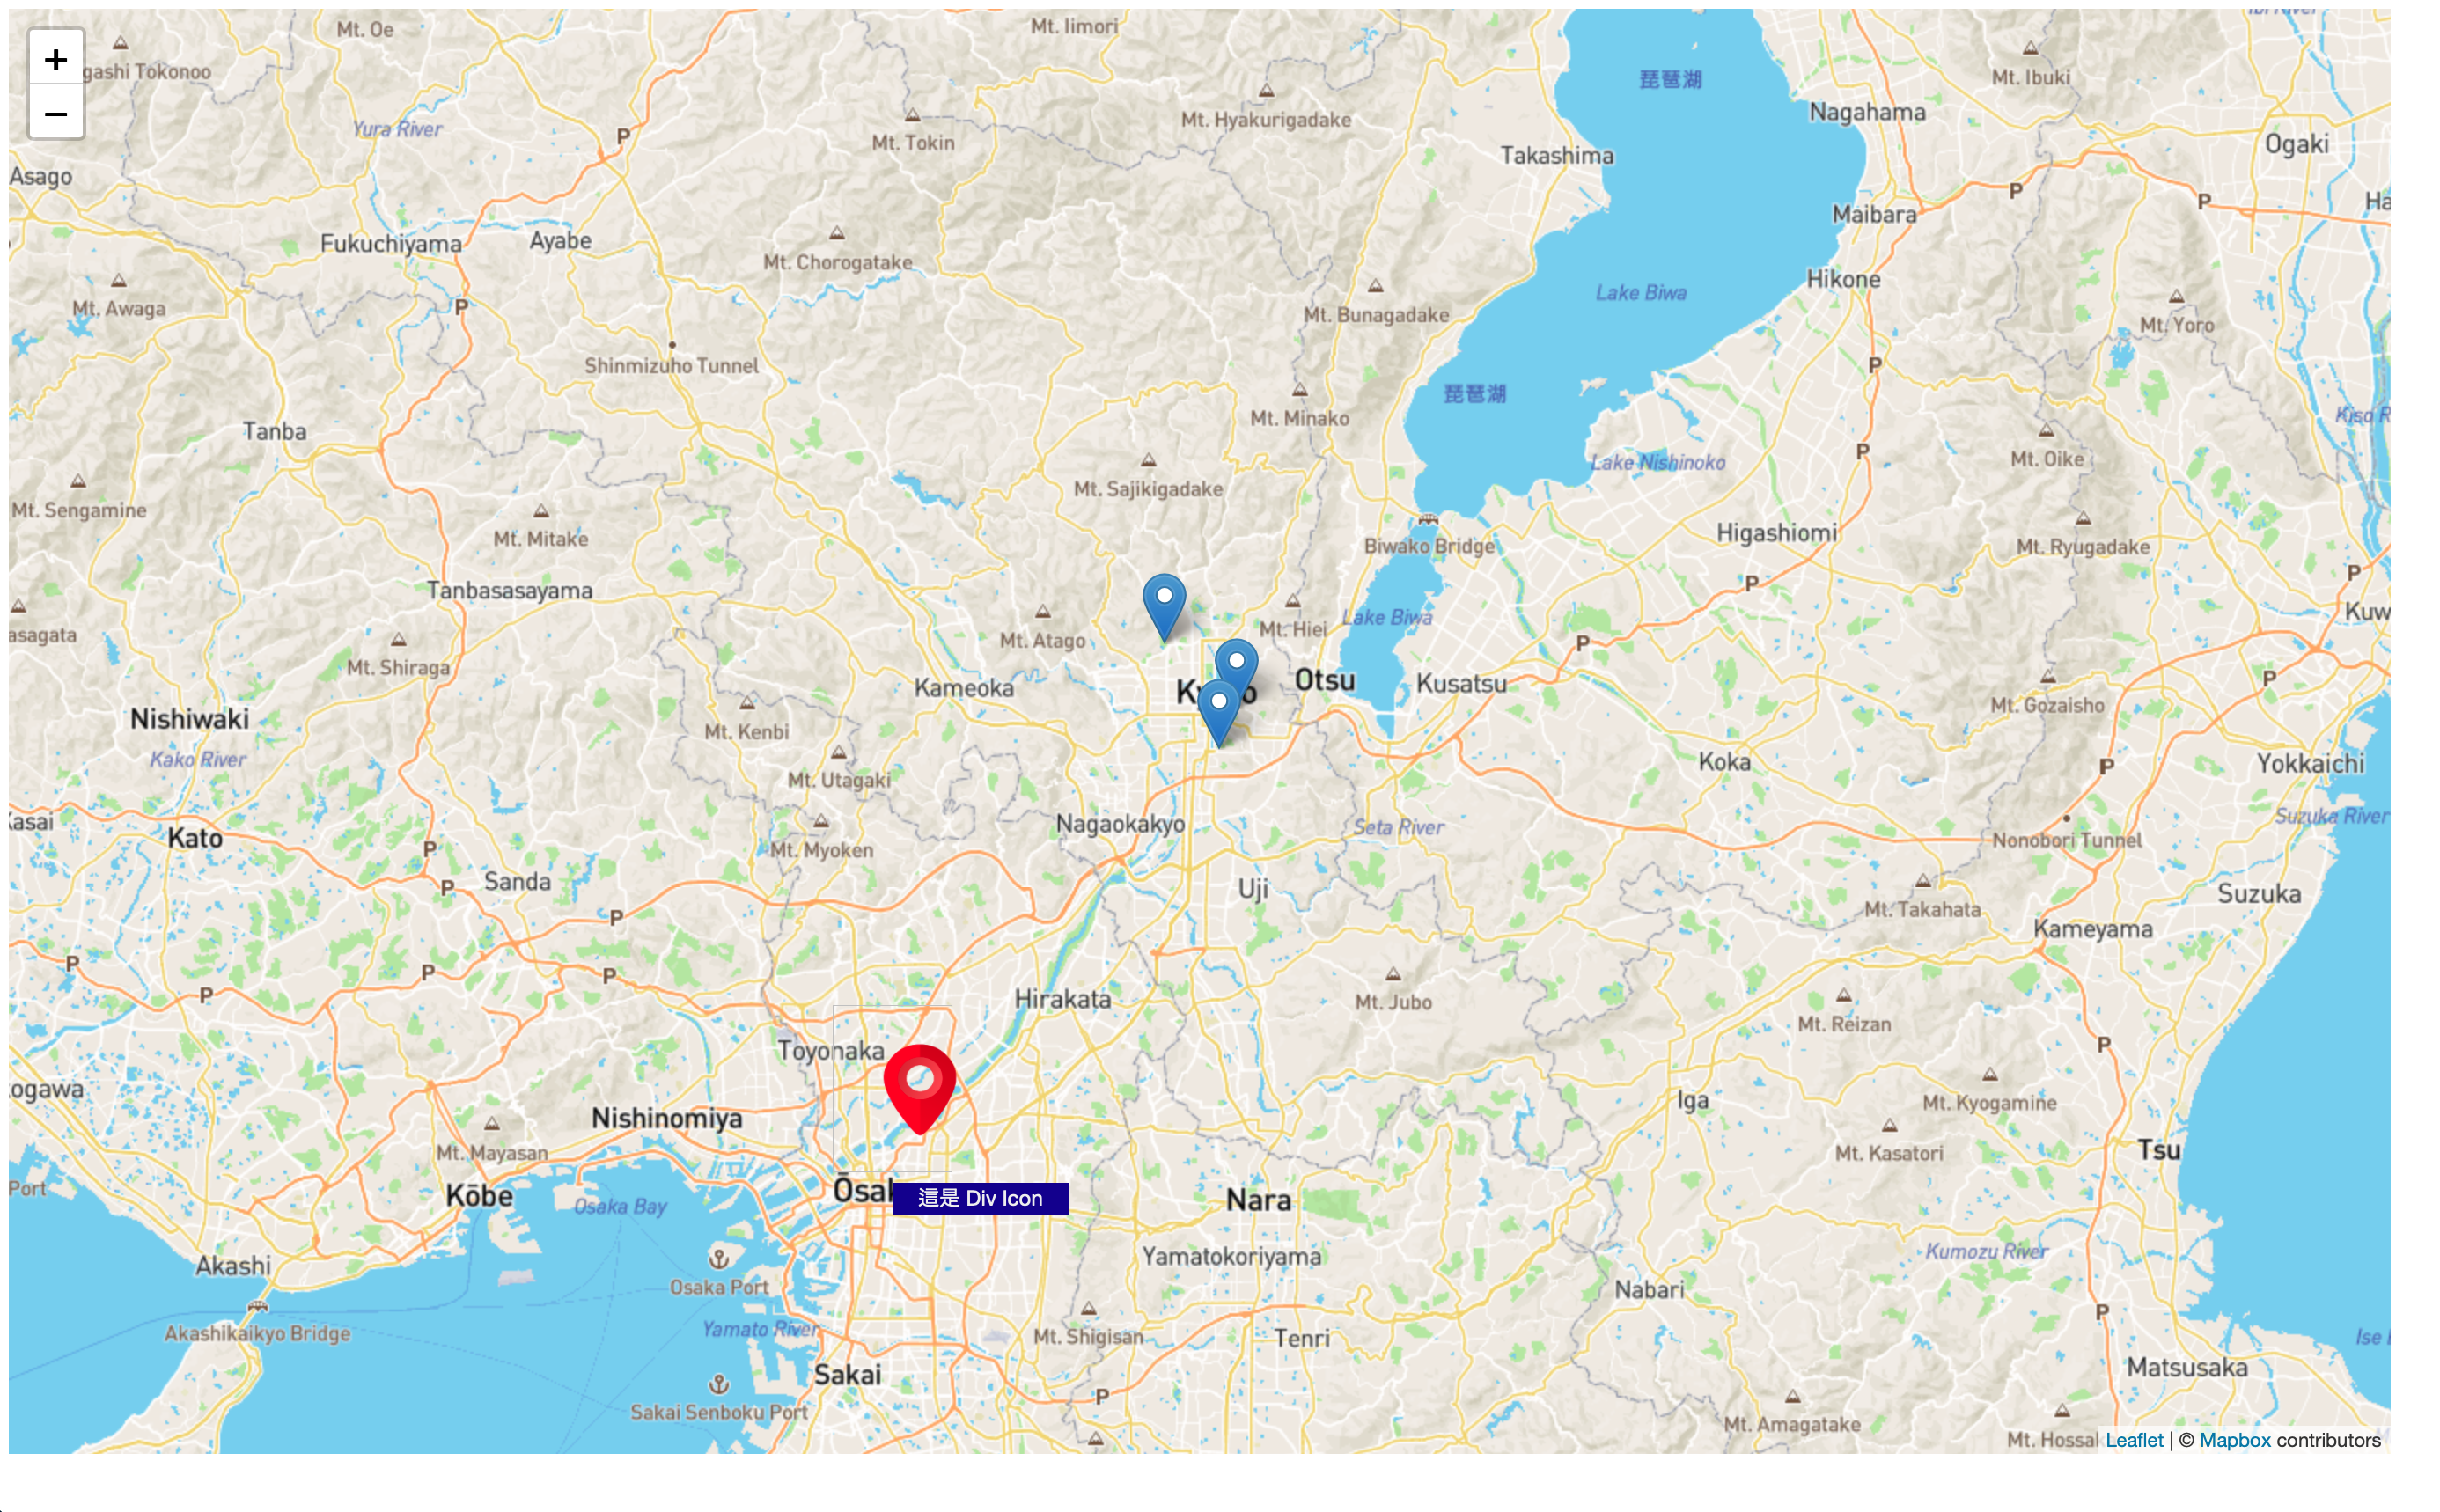
加上 marker
來畫線吧
1var latlngs = [
2    [35.02537491062854, 135.7438607946139],
3    [34.88948810597932, 135.8076289149232],
4    [34.961035819215525, 135.65613226663768],
5    [34.976863645786004, 135.82695459531024],
6    [34.88036360232042, 135.7002729085305],
7    [35.02537491062854, 135.7438607946139],
8];
9L.polyline(latlngs, {color: 'red'}).addTo(map);
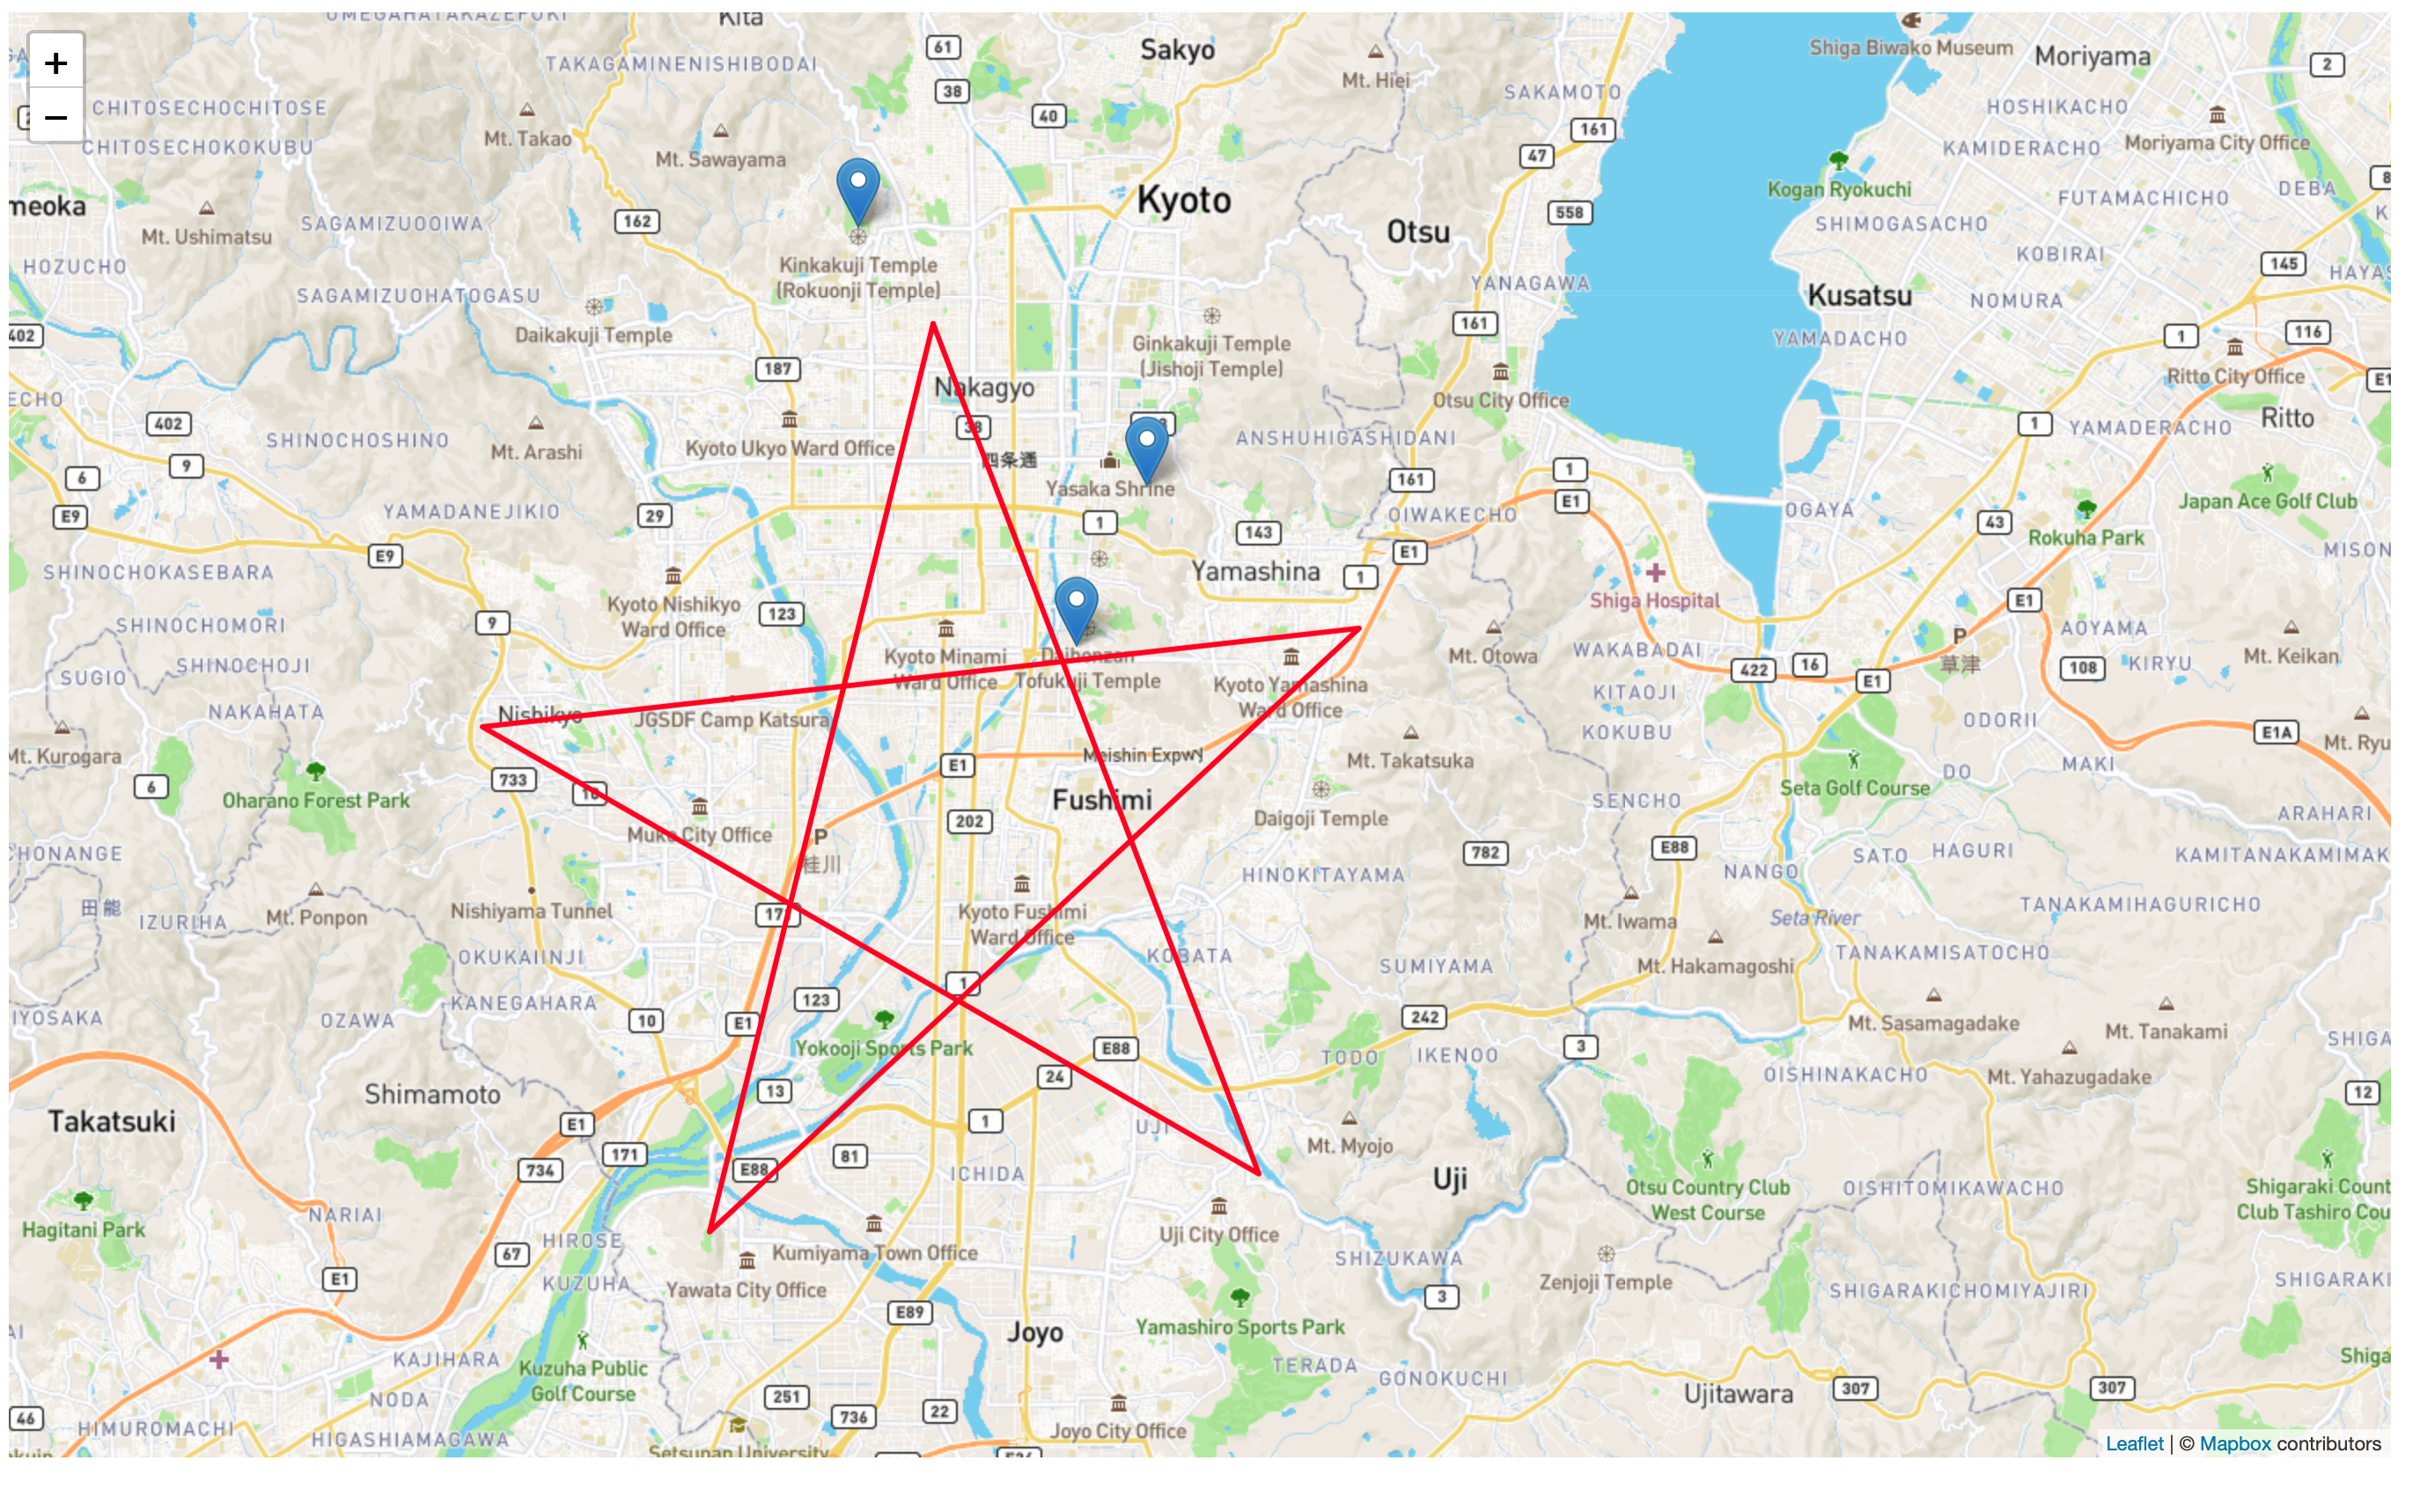
來個封印陣吧!
群組化並加上控制項
我們可以把想要歸在一起的東西放到同一個群組,這樣在接下來要分層顯示的時候,會更簡便一些。
讓我們稍微調整一下程式碼。
 1...
 2
 3let layer1 = L.layerGroup([
 4    L.marker([35.04074994371372, 135.72932367775914]),
 5    L.marker([34.97374817523019, 135.77195253085293]),
 6    L.marker([34.99936852552379, 135.7854861479551])
 7]).addTo(map);
 8
 9...
10
11let layer2 = L.layerGroup([
12    L.marker([34.70432671595862, 135.50096236284378], { icon: myIcon }),
13    L.marker([34.68985107822455, 135.5253549268327], { icon: myDivIcon })
14]).addTo(map);
15
16...
17
18let layer3= L.layerGroup([
19    L.polyline(latlngs, {color: 'red'})
20]).addTo(map);
將我們群組化後的 Layer 加入控制項中。
1let controller = L.control.layers().addTo(map);
2controller.addOverlay(layer1,"Marker");
3controller.addOverlay(layer2,"自定的Marker");
4controller.addOverlay(layer3,"封印陣");
5controller.expand();
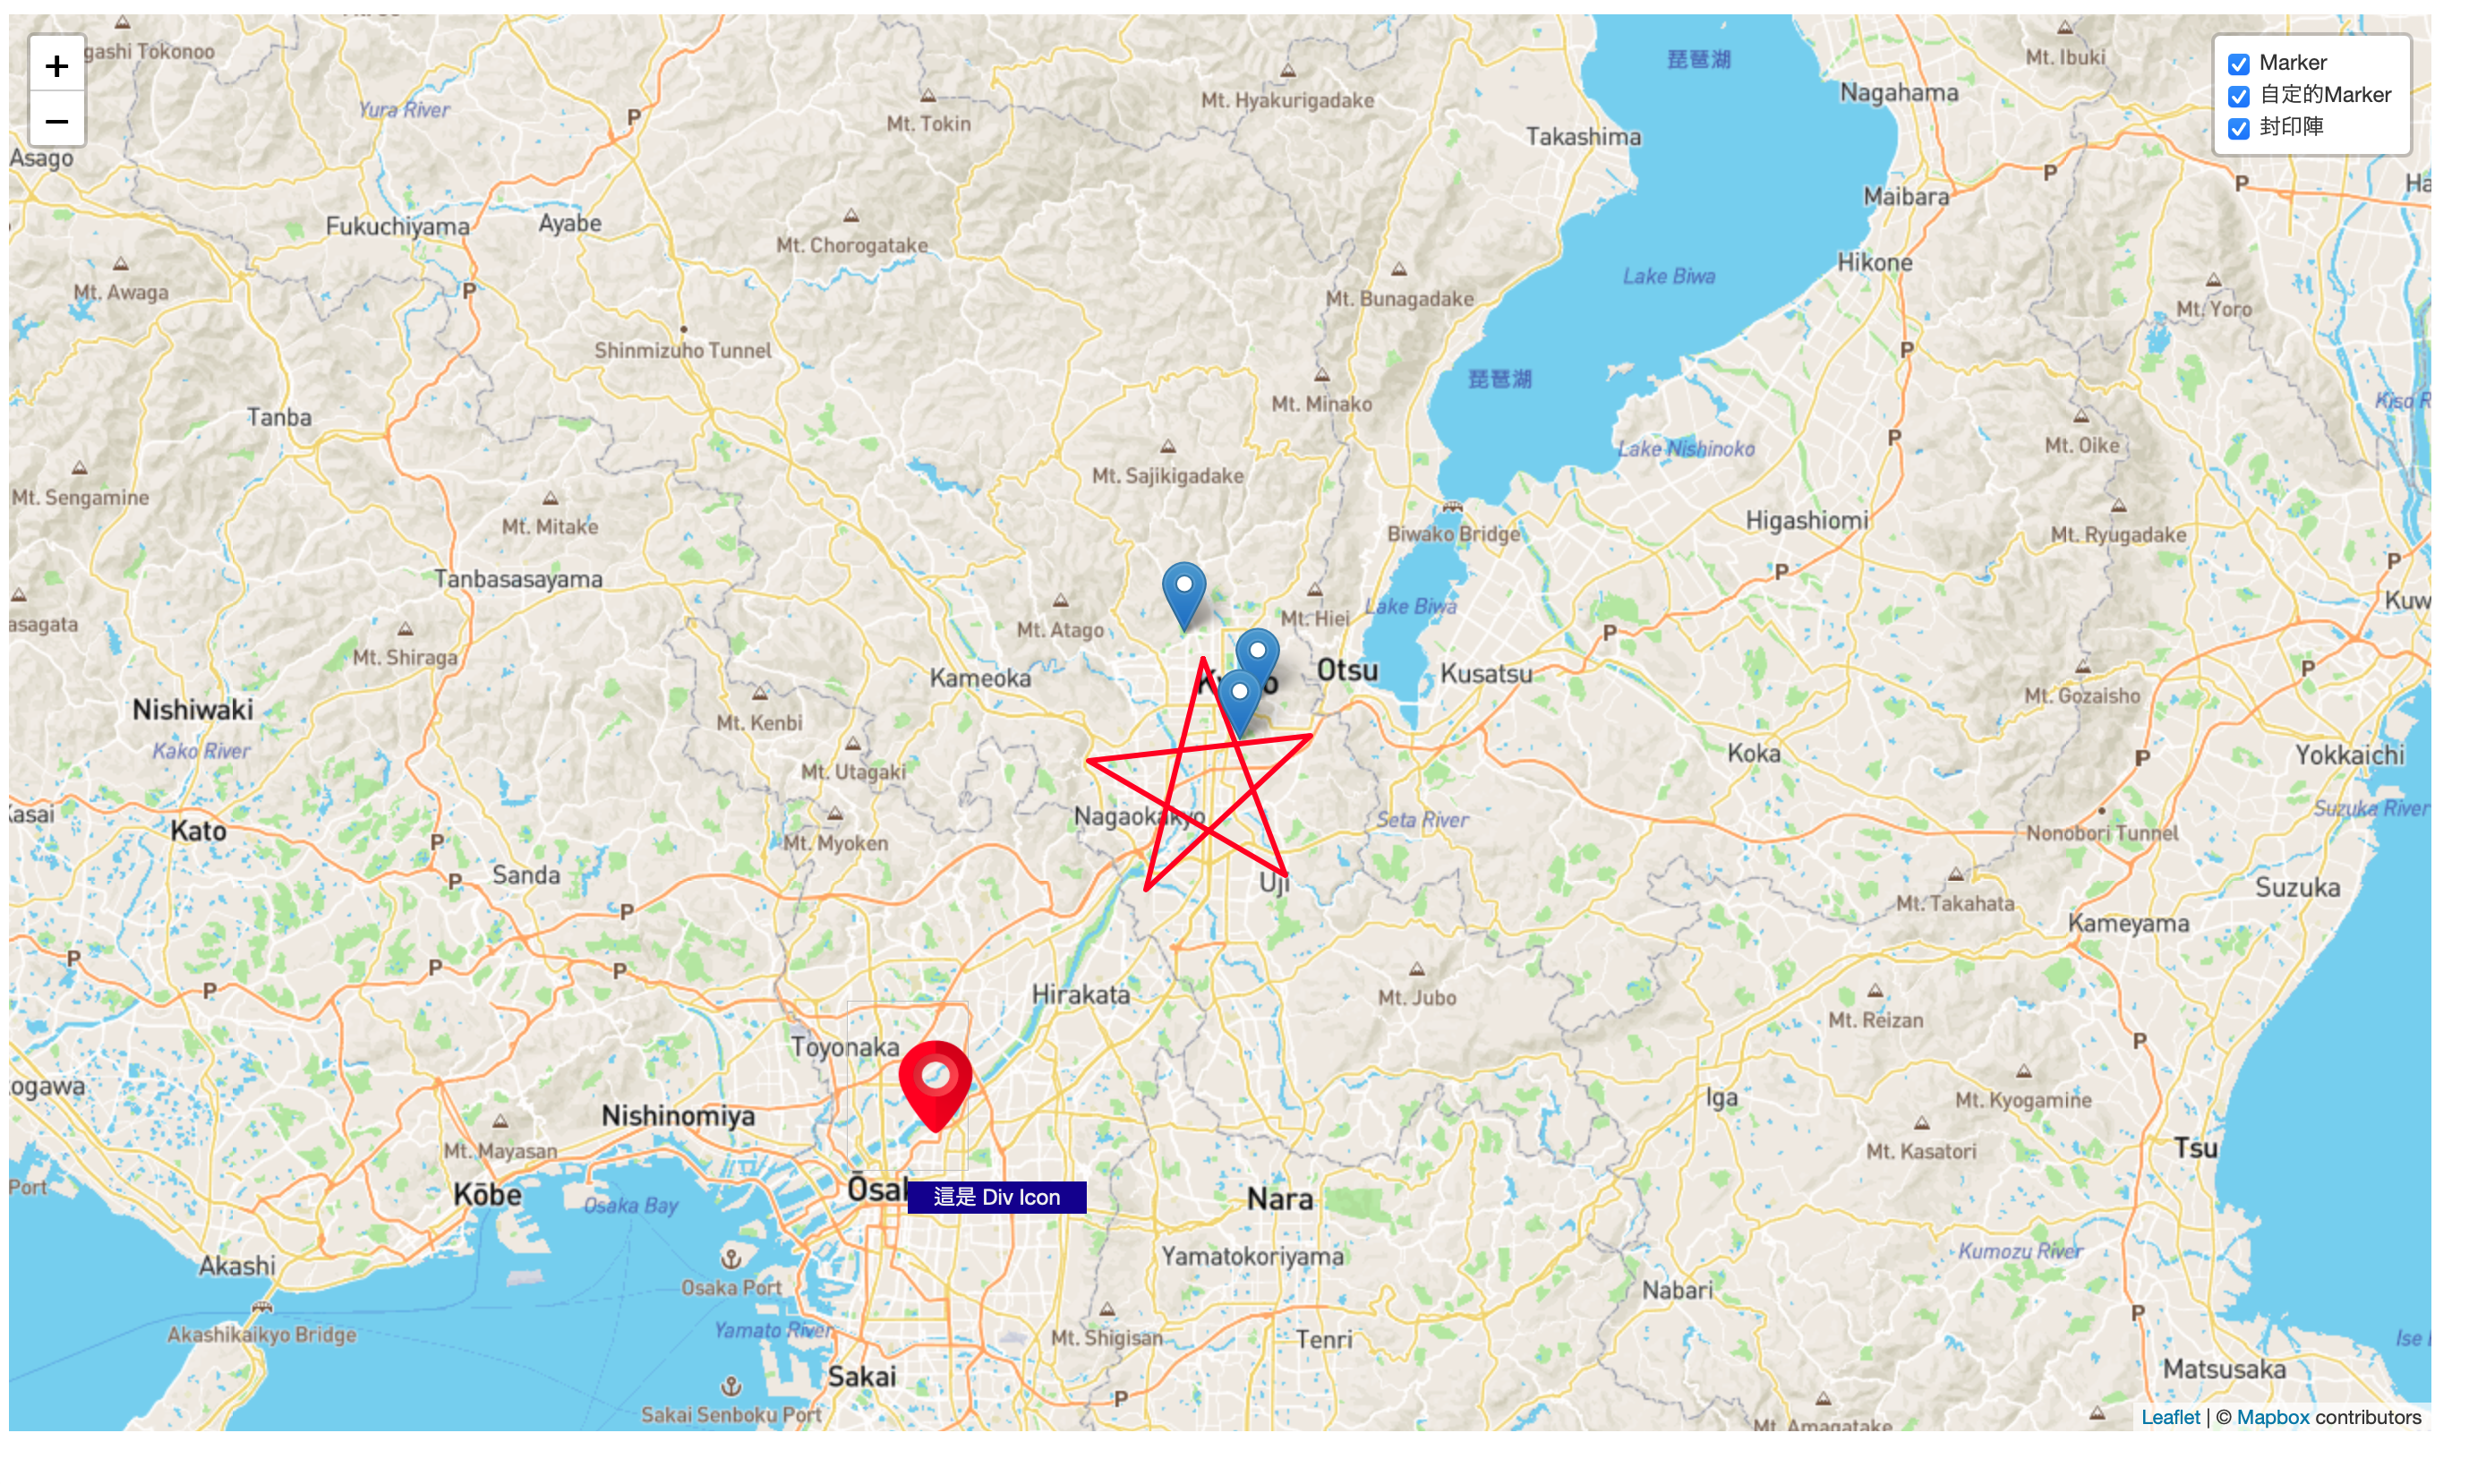
加入控制項
補充一下,如果想移除各個 Layer 的話可以透過下列方式,移除
 1map.value.eachLayer((layer) => {
 2    if (layer instanceof L.Marker) {
 3        map.value.removeLayer(layer);
 4    }
 5});
 6
 7
 8// or
 9
10layer1.remove();
20210808 新增 - geoJSON Layer
測試資料可以到政府開放資料平台取得。
 1
 2let data = {"type":"FeatureCollection", "features": [
 3"type":"Feature","geometry":{"type":"Polygon","coordinates":[[[121.543841724,25.0449066970000,...................... ]]]
 4]}
 5
 6function onEachFeature(feature, layer) {
 7  if (feature.properties && feature.properties.TOWNNAME) {
 8    layer.bindPopup(feature.properties.TOWNNAME);
 9  }
10}
11
12L.geoJSON(data, {
13    onEachFeature: onEachFeature,
14    filter: function(feature, layer) {
15        return feature.properties.TOWNNAME == '大安區';
16    },
17    style: function(feature) {
18        switch (feature.properties.TOWNNAME) {
19            case '大安區': return {color: "#00ff00",weight:1};
20            default: return {color: "#333333",weight:1,opacity:0.5 };
21        }
22    }
23}).addTo(map);
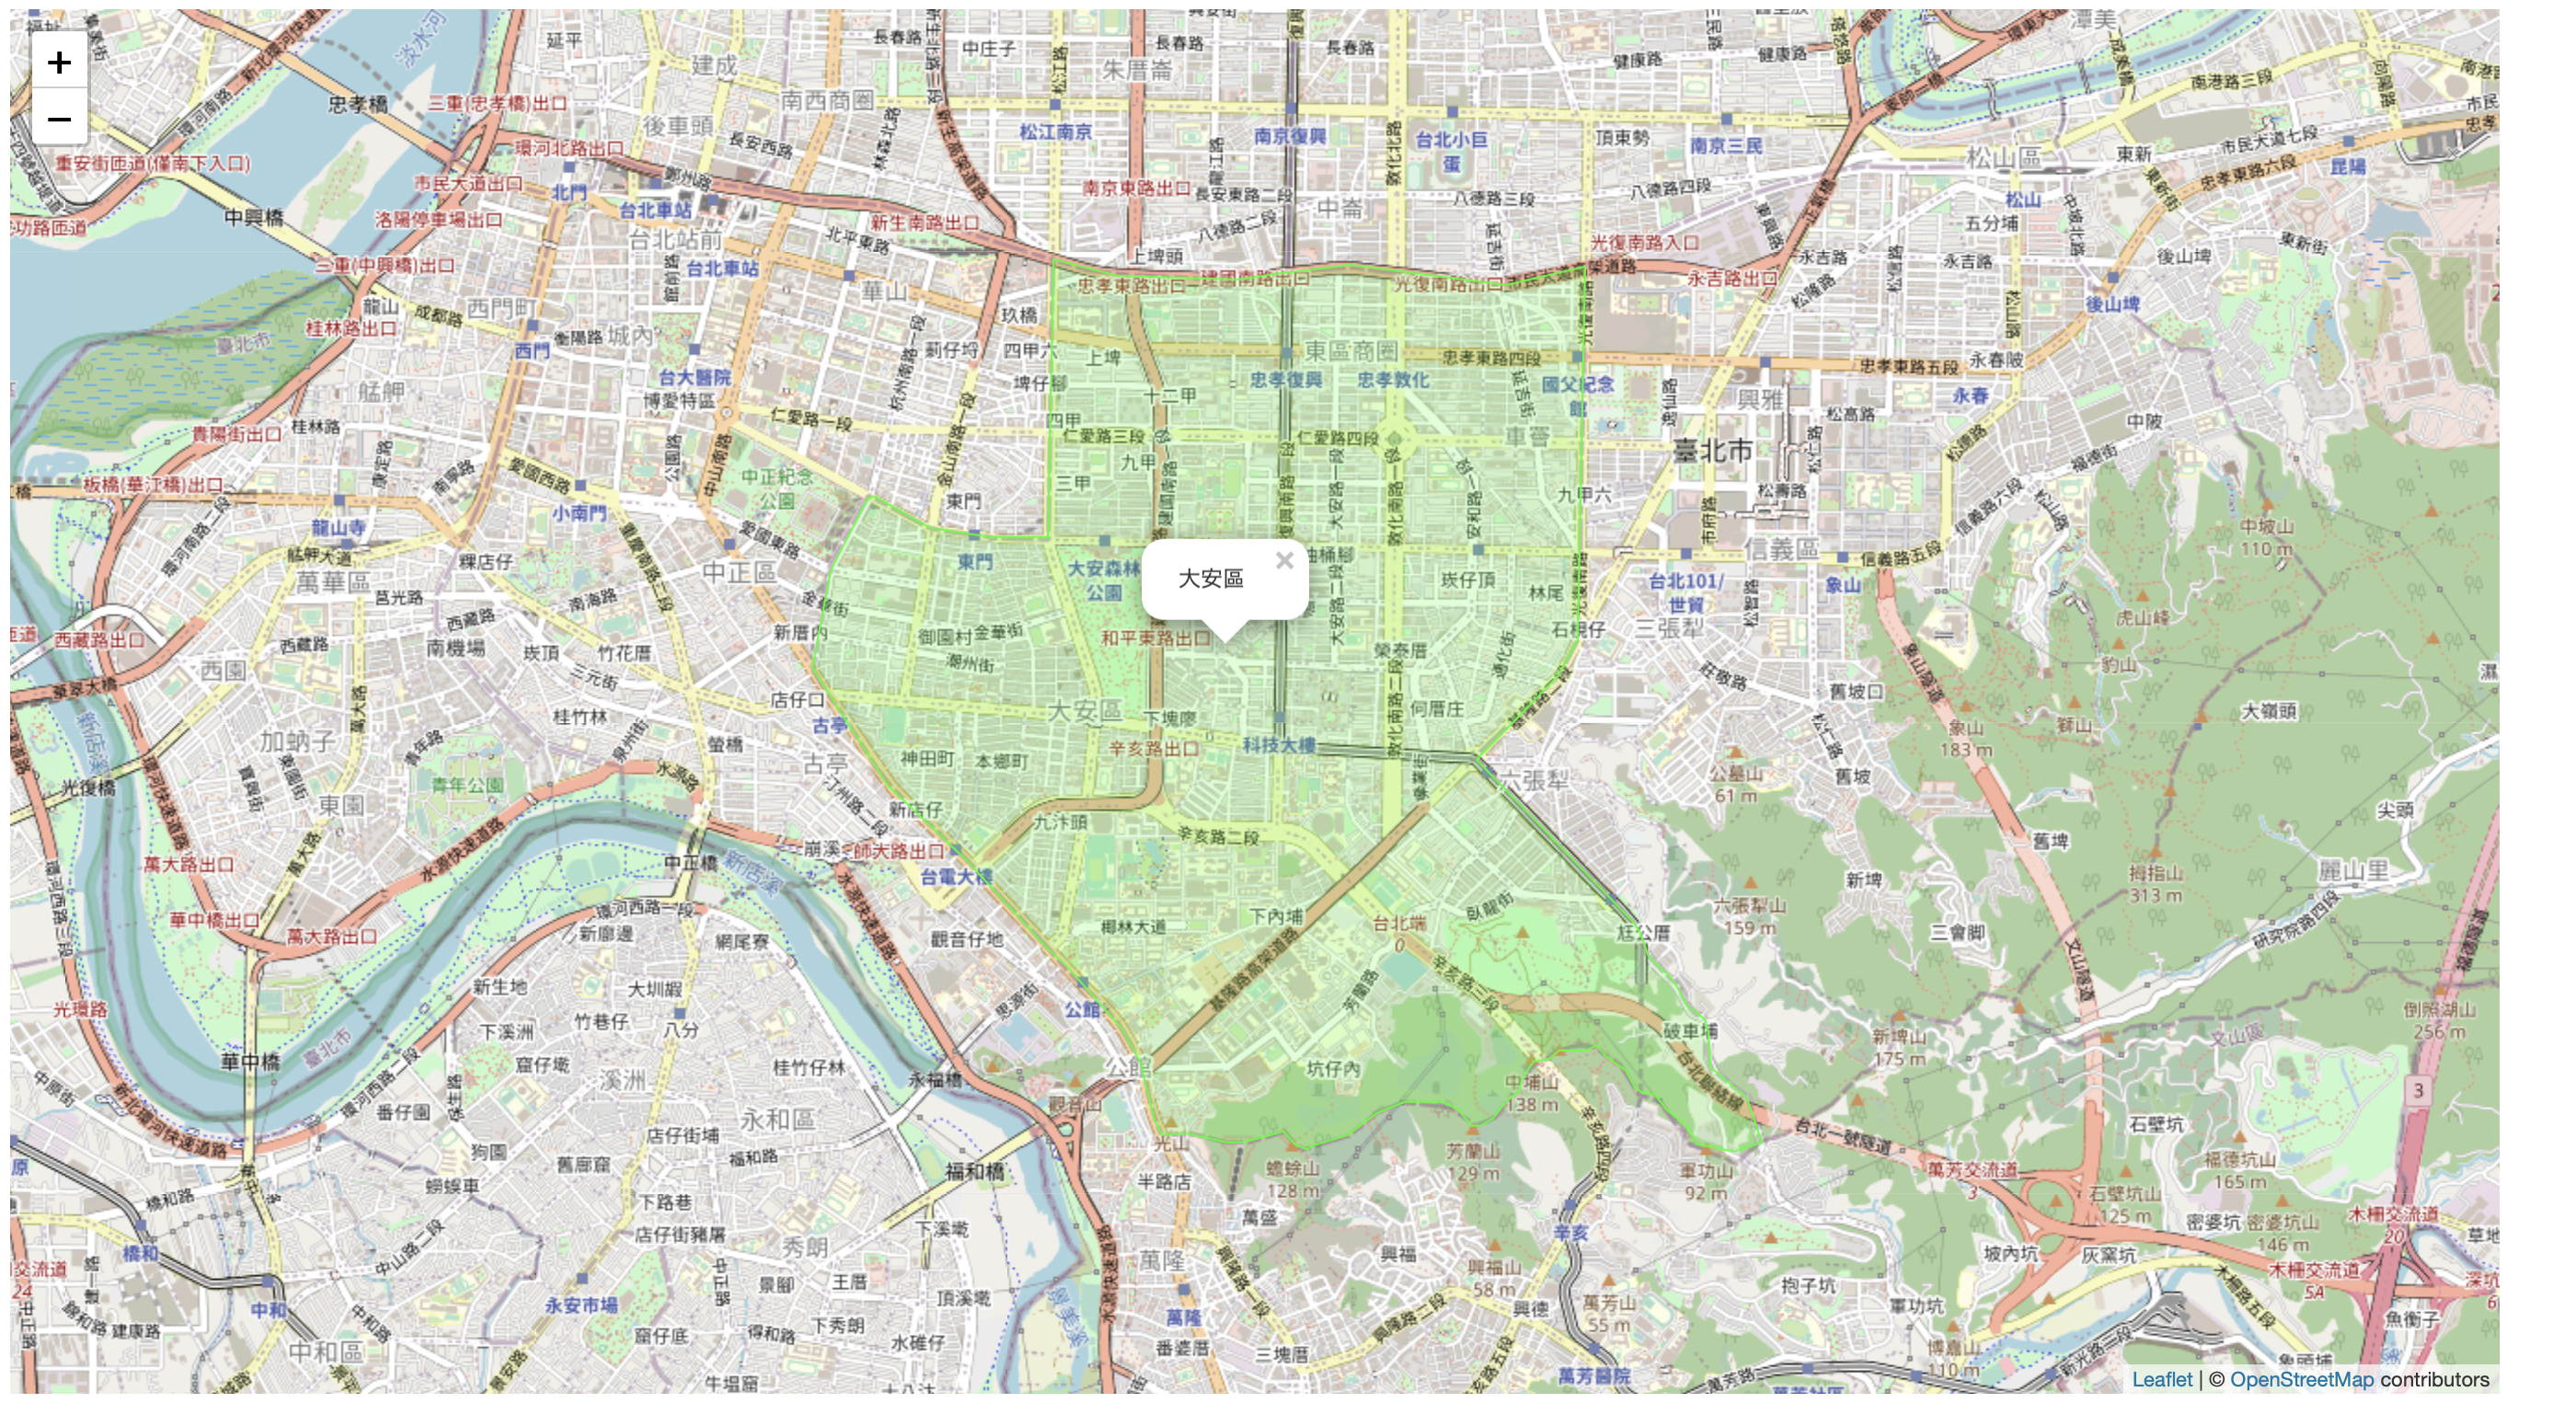
使用 geolayer
成果
小結
使用 Leaflet 之後,不管是在操作 Marker 還是要建立 Path 都變得更加容易了。只能說是相見恨晚!